Who Am I Graphics Part 2
Feb 28 2011
Here is part II: Scott Stowell’s “Explaining Yourself” class mid-semester project requires students to use info-graphics to chart an aspect of their lives. Last Thursday they presented their findings to Emily Oberman of Number 17.
(see Part 1: https://design.sva.edu/site/blog/show/382)
Works from top to bottom:
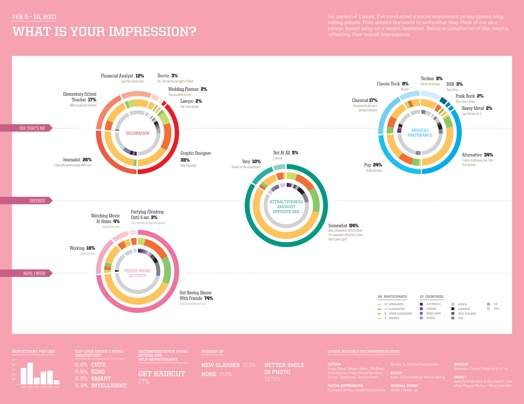
Jesse Senje Yuan
What’s Your Impression
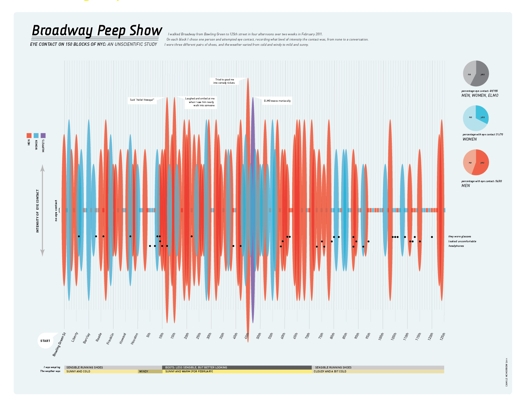
Camille McMorrow
Broadway Peep Show
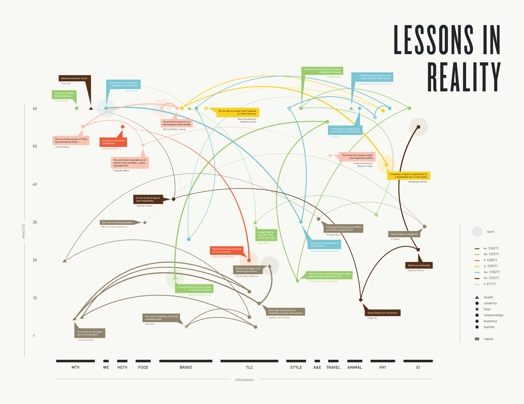
Maya Lee
Reality TV
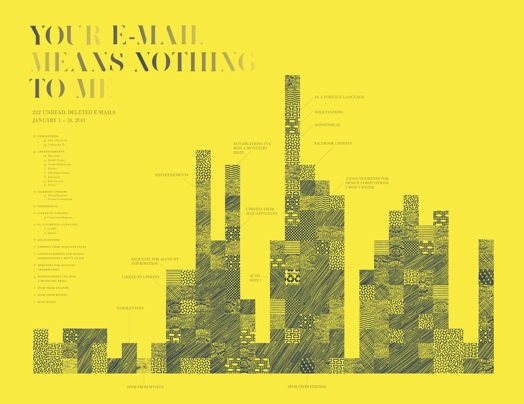
Melissa Gorman
Your E-Mail Means Nothing to Me
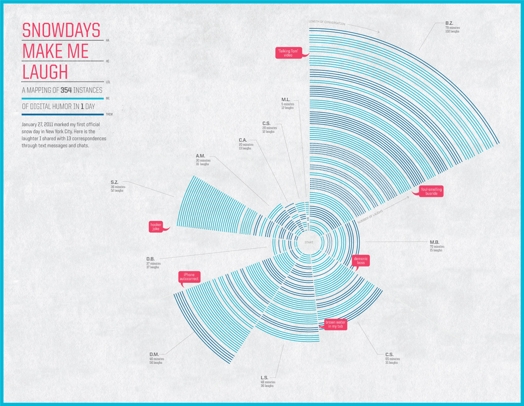
Leen Sadder
Snow Days