
Who Am I Graphics Part I
Feb 18 2011
Scott Stowell’s “Explaining Yourself” class mid-semester project requires students to use info-graphics to chart an aspect of their lives. Last Thursday they presented their findings to Emily Oberman of Number 17.
Here are some of the results from top to bottom:
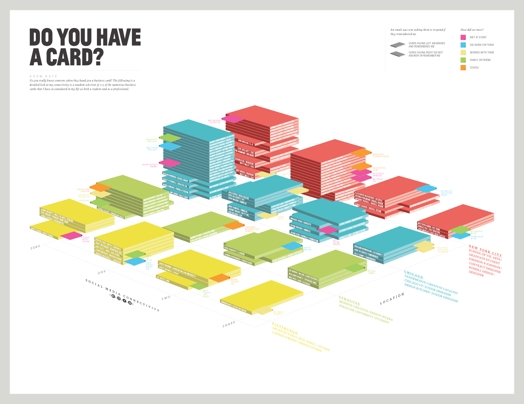
Adam Katz
Life through business cards.
Albert Pereta
Stores through clothes and where they were made.
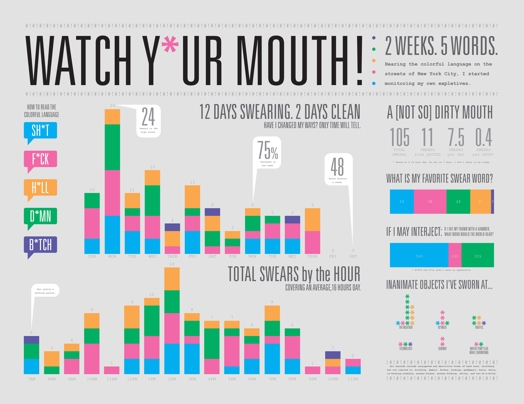
Derek Munn
Charting curses.
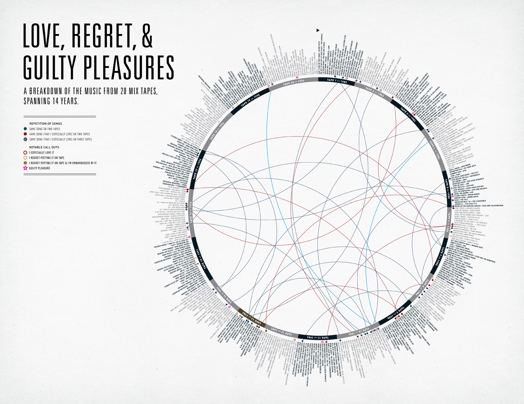
Elisa Bates
A music breakdown
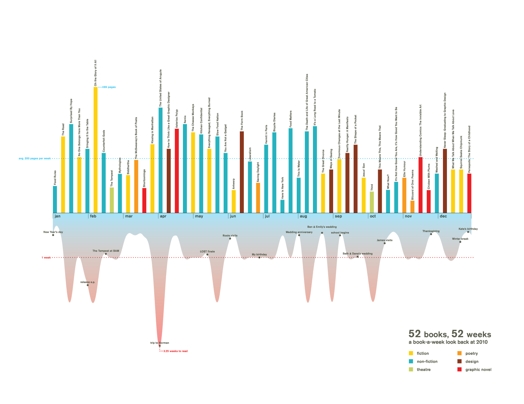
Elliott Walker
Books read each week in 2010
Bruno Zalum
Fingernails injested.
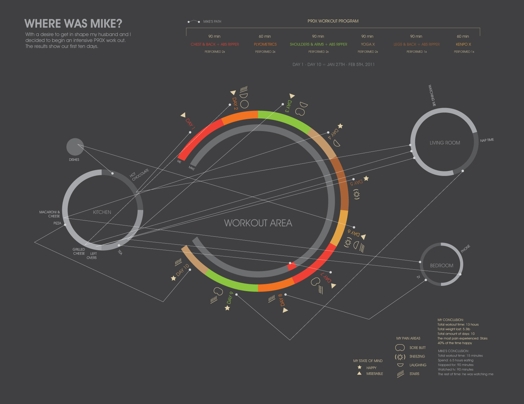
Joanna Kuczek
Getting fit with husband.
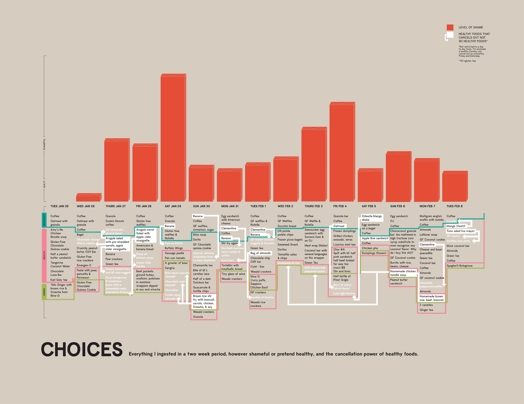
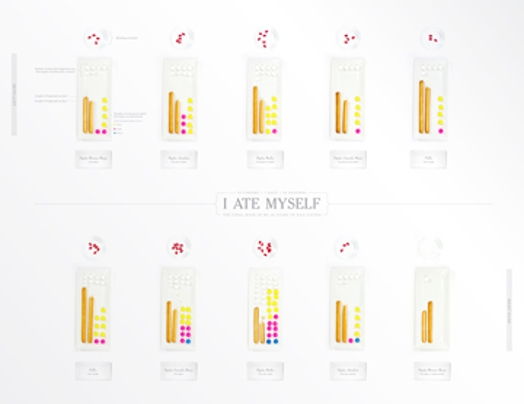
Katie Estes
Everything eaten in two weeks.
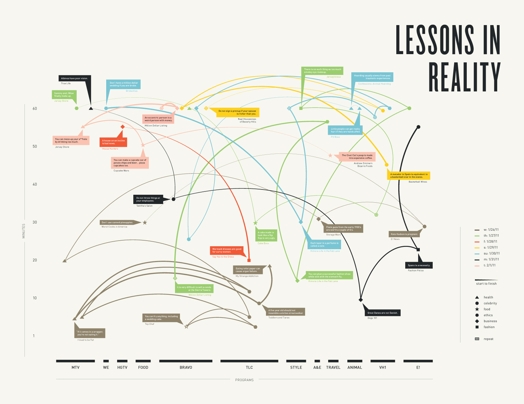
Maya Lee
Watching reality shows on Cable.
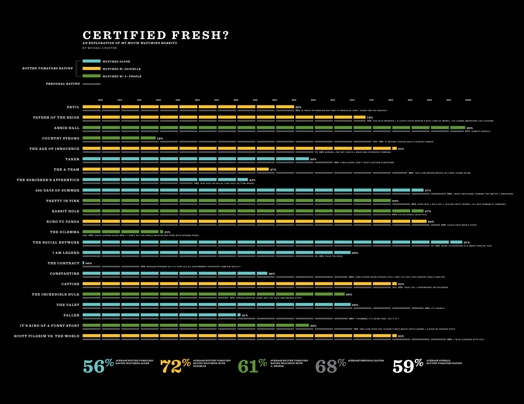
Micahel Croxton
Movie watching habits.
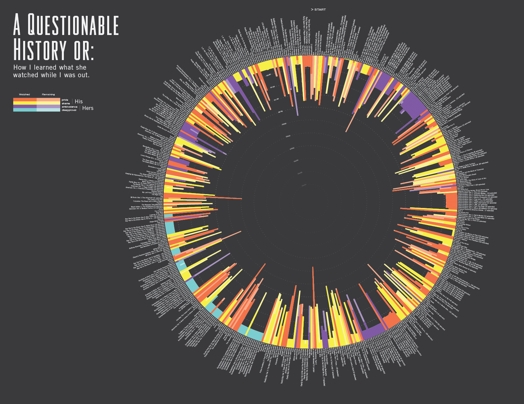
Tim Hucklesby
What she watched “while I was out.”